|
|
|||||||||||
|
Simulation |
|
||||||||||
|
The
Benihana simulation models an evening at Benihana's Following
the instructions below, you will first download the simulation, and then
download a free demo copy of the "Extend" software needed to run
the simulation (be sure it is Version 5, V5, of the software that you
download). |
"Please print this page for reference" |
||||||||||
|
Print this page for reference. 1. Click on this "Download Benihana Simulation" command (this will download the "Benihana.mox" file onto your computer, in the location you specify. If clicking this link does allow you to download this simulation, please right click on the link and select either the "save link as" or "save target as" option to force a download) 2. Click on this "Download Extend" command (you will be linked to www.imaginethatinc.com/prods_player.html) 3. Fill out the registration form and click on "Submit" 4. Click on the “DOWNLOAD” button for Extend 5 Player and follow the instructions to download the Extend application onto your computer in the location you specify You are now set to run the simulation!
Start the Extend application and open
the "Benihana.mox" file that you just
saved by going to the "File" pull down menu and click
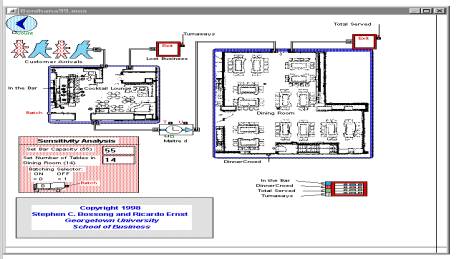
"Open". After the document opens you should see a layout of the
restaurant's floor plan in the "primary window", similar to that
shown below.
Pull down the RUN menu and activate the RUN SIMULATION command. The simulation will generate a plotter that tracks the number of people in the bar (blue plot), the number of dining tables in use (red plot), the total number of customers served (green plot) and the number of customers who opted to depart when the bar was full (gray plot). If you want to run the model with animation in "slow motion" pull down the RUN menu and select "Show Animation". (However, this slows considerably the speed of the simulation.)
The plotter dynamically updates the simulation results, with time displayed on the x-axis (an example of such a plot is given below). The plotter has two y-axis with different scales. The left vertical axis corresponds to the blue plot (number of people in the bar) and the red plot (number of tables in use). The right vertical axis corresponds to the green plot (total number of people served) and the gray plot (number of customers who arrived and turned away since the bar was full).
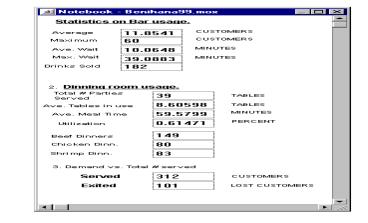
If the plotted data exceeds the range of the display, the plotter can be re-sized by a single mouse click on the "auto-scale Y" command located on the menu bar along the top of the "plotter window". Note that you can re-size the “notebook” box by dragging its lower right hand corner, and you can move it around on your screen by dragging the blue header bar. You can do the same with the “plotter” box. Additional data from the simulation can be accessed once the simulation completes a run. From the MODEL menu, pull down the SHOW NOTEBOOK command. This will bring up a data notebook window (similar to that shown below) that contains simulation results on: utilization rates of the cocktail lounge and dining room, the numbers of each type of dinner served, number of drinks sold as well as the average and maximum wait time for customers in the lounge. However, be aware that the “utilization” figure may not be calculated exactly the same as you may be asked to calculate it in the assignment.
After closing both the notebook and the plotter windows, you will see the main window containing the floor plan. The Sensitivity Analysis block in the lower left corner of the window enables the user to alter the bar's capacity, the restaurant's capacity, and turn "batching" on (= 0) or off (= 1). When the batching switch is "on," customers are "batched" from the lounge area in groups of 8, replicating Benihana's standard policy. When the batching switch is "off," customers are seated in the dining area based upon the size of their party. (e.g. If a group arrives as a party of five, they will be seated as a party of five and completely occupy an eight-place table). To run the simulation consecutively up to four times, pull down the RUN menu and select SIMULATION SETUP. This brings up a window that contains an option to change NUMBER OF RUNS. Enter the desired number of runs and select RUN NOW. As each run is executed, the software saves the new plot over the previous. Once all four runs are completed, the results of each may be viewed by a "single click" on the "page tab" at the bottom left corner of the plotter window. However, be aware that the notebooks statistics will be those for just the last run, rather than the average of all four runs.
Demand Profile:
Benihana Floor Plan and Operating Procedures (unless otherwise specified):
Customer Habits and Preferences:
|
||||||||||||
|
|
|
|||||||||||
|
|
||||||||||||
|
ã 2000 McDonough School of Business, Georgetown University. All rights reserved. |
||||||||||||